
Real-Life Spaghetti Diagrams

Spaghetti Diagram - Custom Joinery Factory
We all know about Spaghetti Diagrams to illustrate 'Transport' as 'waste' to be eliminated during Lean training.
But what if you could capture a REAL Spaghetti Diagram of an actual operator doing actual work? This diagram captures real operator movements over 4hrs in a Custom Joinery Factory.
And what if you could watch all the movements and analyse for improvement? We use the 'Spaghetti Diagram' for further analysis and improvement.
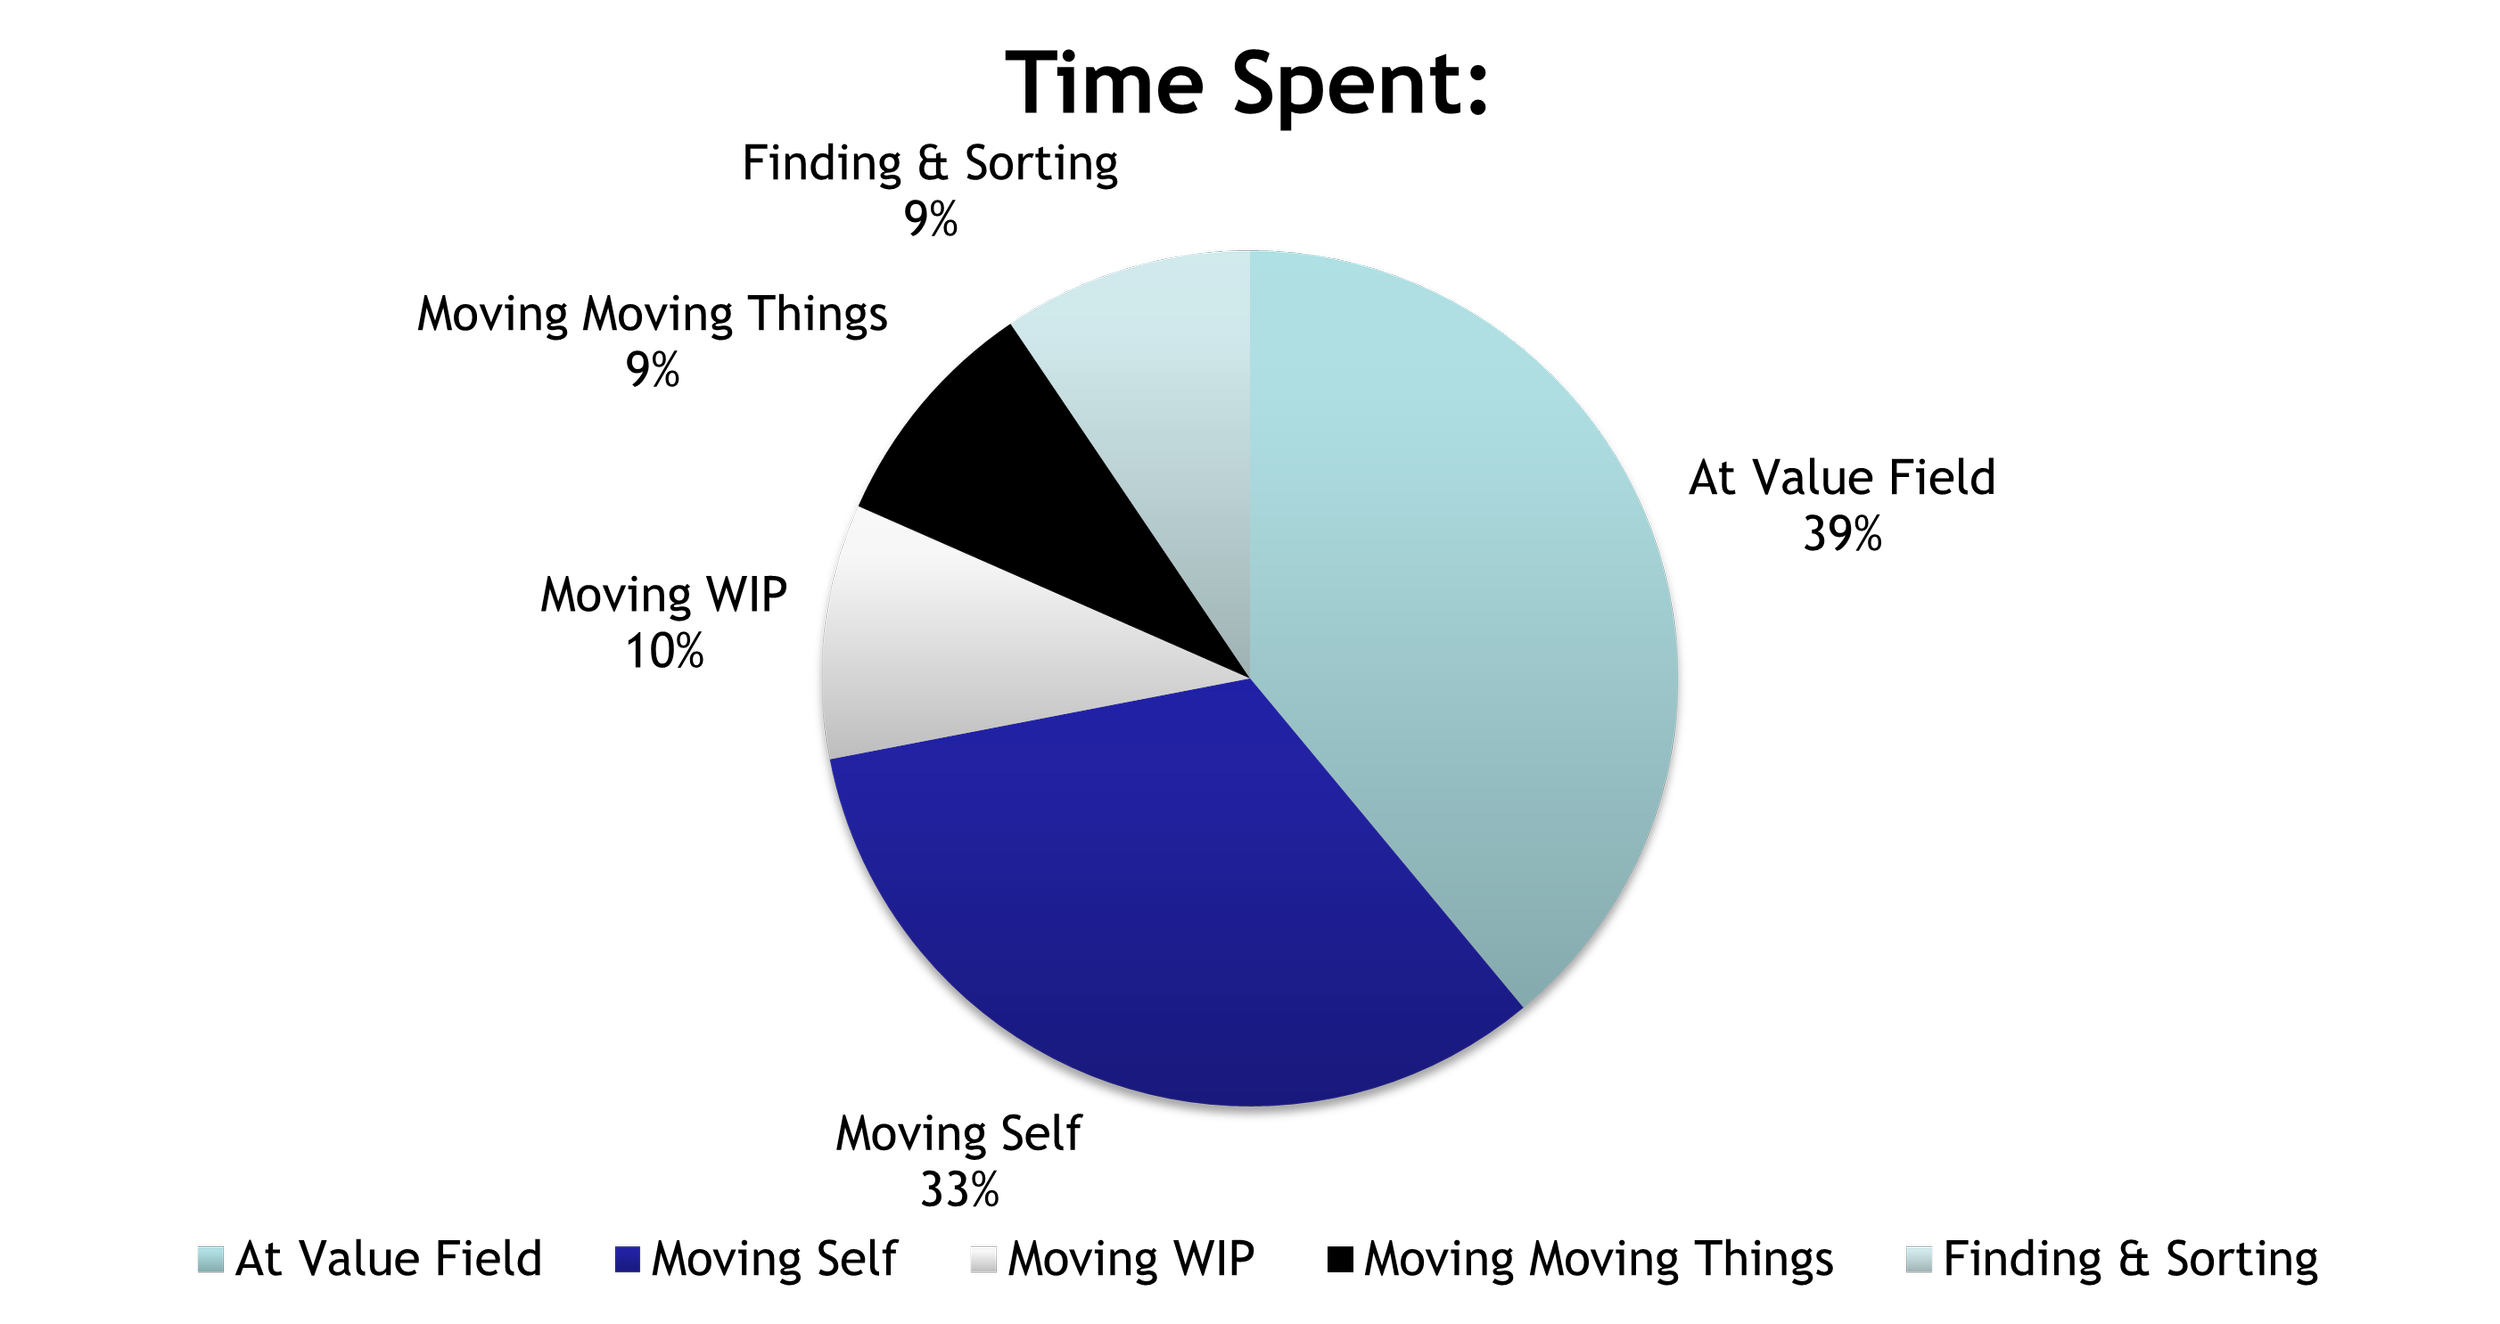
We further analysed the action maps behind the spaghetti diagram to measure the amount of time spent in different activities. We can say only 39% of the operator time was spent at their value field. The value field is the place of work where the operator adds value to the product or job. Moving self is a walk away from the value field where nothing is carried taken or moved anywhere. Moving whip is rearranging wip but not adding any value or performing any work on it. Moving moving things is when a trolley or a forklift is moved empty no work is being transported we're just moving the vehicle around. Finding and sorting is where the operator is looking through wip or looking for tools but not adding any value.
The next step was for the supervisor to spend some time with the operator and find out why each of these activities apart from being at the value field were needing to be done. This was done in a cooperative collaborative fashion with a view to eliminating the need for all of these other activities.
Maybe we needed somebody else to deliver things to the operator. Maybe the operator needed additional information that was not at the workstation. Maybe we needed to add a water spider to the shop floor to pick up deliver and move things around so that the operators could continue to add value at their value field.
The work was rearranged so that the operator could spend more time at the value field a new analysis showed that up to 60% of the operated time was now spent at the value field doing work this is a 50% increase in available time and productivity.
Action mapping to generate spaghetti diagrams and analysis of work patterns is a powerful tool for performance improvement. Contact Glen to learn more about action maps spaghetti diagrams and improving productivity.